
Cell-cell communication is fundamental to many biological processes, including immune regulation, tissue development, differentiation, and disease progression.
In single-cell RNA sequencing (scRNA-seq) and spatial transcriptomics studies, computational cell-cell communication analysis can help researchers investigate how different cell populations may interact through ligand-receptor signaling.
Tools such as CellChat and CellPhoneDB infer potential communication relationships by integrating gene-expression data with curated ligand-receptor information. These predicted interactions are often visualized as network plots, allowing researchers to examine signaling patterns across multiple cell populations.
However, interpreting a cell-cell communication network requires more than simply identifying the strongest connections. This guide explains the major elements of a communication network plot, introduces a practical three-step interpretation strategy, and discusses how to avoid overinterpreting computational predictions.
At Omics Empower, we support researchers with integrated single-cell sequencing, spatial transcriptomics, and bioinformatics solutions for investigating cellular interactions and signaling within complex biological systems.
Although visualization conventions vary between analysis tools and plotting settings, most cell-cell communication networks contain several common elements.
Each node usually represents a defined cell population or cell type identified from the single-cell dataset. Depending on the biological system, these may include immune populations such as T cells, macrophages, B cells, NK cells, and dendritic cells, as well as stromal or progenitor populations such as mesenchymal stromal/stem cells (MSCs), osteogenic progenitors, and chondrogenic progenitors. Node colors are commonly used to distinguish different cell populations.
A self-loop represents an inferred communication relationship in which the sender and receiver belong to the same annotated cell population. This pattern may be consistent with autocrine or within-population signaling, where ligands expressed by a cell population correspond to receptors expressed within that same population.
Interpretation note: Because conventional scRNA-seq communication analysis is generally performed at the cell-population level, a self-loop does not necessarily demonstrate that the same individual cell both produces the ligand and responds through its receptor.
Connections between nodes represent inferred communication relationships between different cell populations. Depending on the analysis method and visualization settings, network edges may encode information such as:
Interaction strength or communication probability
Number of predicted ligand-receptor interactions
Signaling pathway activity
Direction of predicted signaling
Important: Colors and line thickness should always be interpreted according to the figure legend and the parameters used to generate the network. Red, blue, thick, or thin edges do not have a universal meaning across all tools and plots.
In many directional network visualizations, an arrow from cell type A to cell type B indicates that A is treated as the sender population, expressing the ligand, while B is treated as the receiver population, expressing the corresponding receptor.
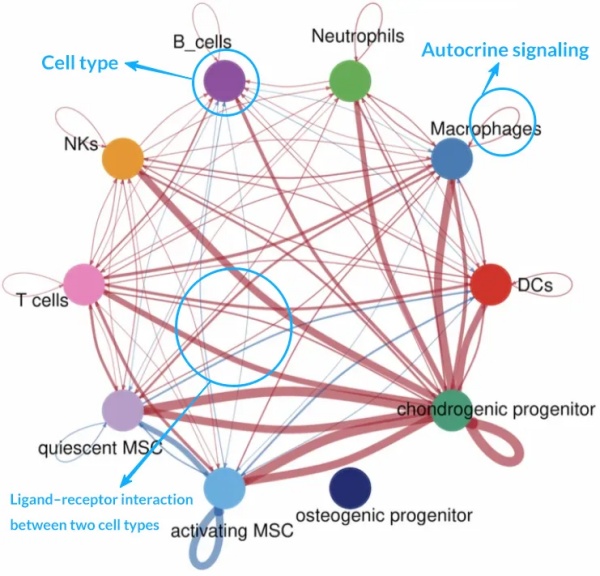
Figure 1 | Example cell-cell communication network in a tissue microenvironment. Interpret edge color and width according to the specific analysis output and figure legend.
Start by examining the overall network architecture. Cell populations with numerous or relatively strong predicted interactions may represent highly connected components of the communication network. Depending on the analysis method, network-centrality measurements can also be used to identify populations with prominent outgoing or incoming signaling patterns.
These populations can be considered candidate communication hubs for further investigation rather than automatically being interpreted as dominant biological regulators.
Next, distinguish between sender and receiver populations. A cell population with strong outgoing signaling may represent an important source of ligands, whereas a population with strong incoming signaling may be particularly responsive to signals from its surrounding microenvironment. Examining these directional relationships can help generate hypotheses about potential upstream and downstream cellular interactions.
A global network provides a useful overview, but biological interpretation should not stop at the network level. Researchers should examine which ligand-receptor pairs and signaling pathways contribute to the observed connections.
Which ligands are highly expressed in the sender population?
Are the corresponding receptors expressed in the receiver population?
Which signaling pathways contribute most strongly to the predicted interaction?
Are the ligand-receptor relationships biologically consistent with the tissue or disease context?
Do downstream genes in the receiver population support the proposed signaling mechanism?
For analyses that prioritize ligands based on potential downstream target-gene responses, researchers may also consider NicheNet. Integrating communication results with differential expression, pathway analysis, spatial information, and experimental validation can provide stronger evidence for biologically meaningful interactions.
Consider a hypothetical network containing T cells, macrophages, dendritic cells, MSC populations, chondrogenic progenitors, and osteogenic progenitors.
Suppose chondrogenic progenitors, T cells, and macrophages display numerous strong connections with other populations. This pattern would indicate that these populations occupy highly connected positions within the inferred communication network. They may therefore be prioritized for downstream analysis of specific signaling pathways and ligand-receptor pairs.
In contrast, if osteogenic progenitors display relatively few inferred connections, the current analysis suggests that fewer ligand-receptor interactions were detected for this population under the selected analytical conditions. However, this should not automatically be interpreted as biological inactivity. The result may also be influenced by cell abundance, sequencing depth, gene-expression levels, ligand-receptor database coverage, statistical thresholds, or the communication-inference method used.
T cells → Chondrogenic progenitors
If the network indicates strong predicted signaling from T cells toward chondrogenic progenitors, the next step is to identify the ligand-receptor pairs responsible for the connection. If relevant cytokine, chemokine, or growth-factor signaling pathways are identified, they may provide hypotheses about how immune-cell-derived signals influence the state or differentiation of chondrogenic progenitors. These hypotheses should then be evaluated using pathway-level analysis, downstream transcriptional responses, spatial evidence, or experimental validation.
Quiescent MSCs → Activated MSCs
A weaker predicted connection from quiescent MSCs toward activated MSCs may indicate a lower inferred communication score or fewer detected ligand-receptor interactions, depending on how the network was constructed. Rather than concluding that the interaction directly drives MSC activation, researchers can investigate the specific signaling molecules involved and determine whether they are consistent with known MSC activation pathways.
If extensive predicted interactions are observed among T cells, macrophages, and dendritic cells, the network may indicate substantial communication among immune populations within the tissue microenvironment. Similarly, strong predicted interactions between immune cells and MSC or progenitor populations may suggest potential immune-stromal crosstalk.
Such observations can generate hypotheses related to inflammatory regulation, tissue repair, regeneration, or differentiation. However, cell-cell communication analysis is primarily a hypothesis-generating computational approach. Expression of a ligand and its receptor supports the possibility of communication but does not, by itself, demonstrate that functional signaling occurs in vivo.
One of the most common mistakes in cell-cell communication analysis is stopping at the network plot. A network can identify potentially interesting sender-receiver relationships, but mechanistic interpretation requires deeper analysis.
Cell population → Sender/receiver relationship → Signaling pathway → Ligand-receptor pair → Downstream response → Biological validation
For example, after identifying macrophage-to-progenitor signaling, researchers can investigate which macrophage-derived ligands contribute to the interaction, which receptors are expressed in the progenitor population, and whether downstream transcriptional changes are consistent with activation of the proposed pathway. Spatial transcriptomics can provide an additional layer of evidence by determining whether predicted sender and receiver populations are located close enough within the tissue to plausibly interact.
Cell-cell communication analysis provides a useful framework for exploring potential signaling relationships in single-cell RNA-seq and spatial transcriptomics datasets. When interpreting a communication network, researchers should focus on three key questions:
1. Which cell populations are highly connected within the network?
2. Which populations act primarily as predicted senders or receivers?
3. Which ligand-receptor pairs and signaling pathways explain these relationships?
Most importantly, computationally inferred ligand-receptor interactions should be treated as biological hypotheses rather than direct evidence of functional communication. By combining cell-cell communication analysis with differential expression, pathway analysis, spatial information, and experimental validation, researchers can move from descriptive network patterns toward more robust biological mechanisms.
Reliable cell-cell communication analysis begins with high-quality single-cell data and requires appropriate bioinformatics methods and careful biological interpretation. If your research involves ligand-receptor interactions, immune-stromal crosstalk, signaling pathways, or complex tissue microenvironments, Omics Empower provides integrated single-cell sequencing, spatial transcriptomics, and validation solutions to support your research.
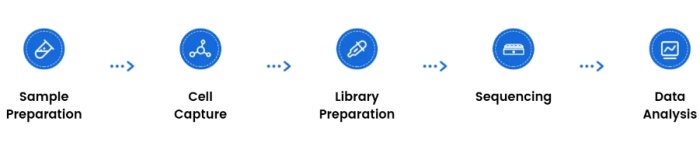
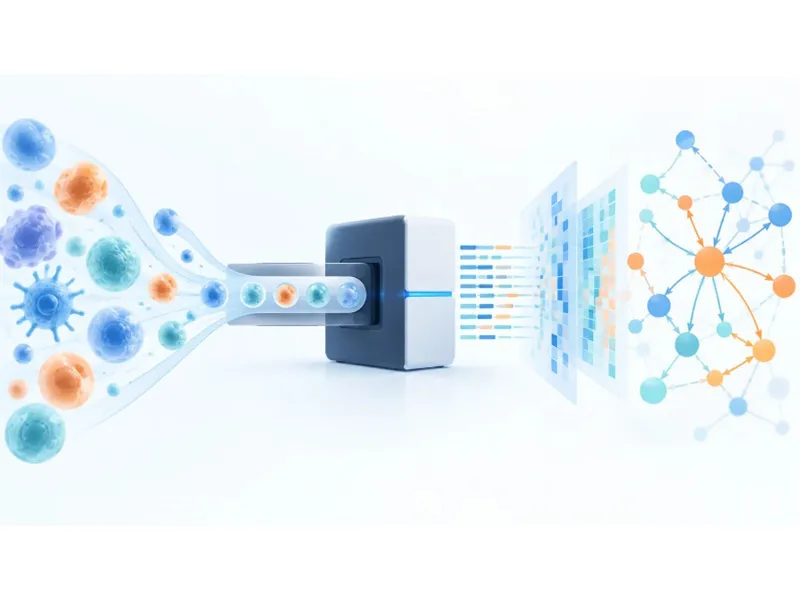
Omics Empower workflow overview
Our team has supported more than 500 peer-reviewed publications across single-cell and spatial transcriptomics research, including studies published in Nature, Science, and Cell。
Whether you are working with fresh cells, fresh tissue, frozen samples, or clinically collected material, we can help assess the most suitable workflow for your project.
1. Jin S, Guerrero-Juarez CF, Zhang L, et al. Inference and analysis of cell-cell communication using CellChat. Nature Communications. 2021;12:1088. doi:10.1038/s41467-021-21246-9.
2. Browaeys R, Saelens W, Saeys Y. NicheNet: modeling intercellular communication by linking ligands to target genes. Nature Methods. 2020;17:159–162. doi:10.1038/s41592-019-0667-5.
3. Troulé K, Petryszak R, Prete M, et al. CellPhoneDB v5: inferring cell-cell communication from single-cell multiomics data. Nature Protocols. 2025;20:3412–3440. doi:10.1038/s41596-024-01137-1.
scRNA-seq vs. snRNA-seq: How to Choose the Right Workflow for Your Study
Microbial Single-Cell RNA Sequencing: Technical Challenges and Solutions
Is Cell Subtype Annotation Necessary in Single-Cell RNA Sequencing?
Plant Single-Cell Sequencing: 3 Databases for Cell Type Annotation
Germany: Arnold-Graffi-Haus / D85 Robert-Rössle-Straße 10 13125 Berlin
United States: (CA) 2 Goddard, Irvine, CA 92618
United States: (IL) 8255 Lemont Rd, #1, Darien, IL 60561
Hong Kong: Unit 615, Building 11W, Hong Kong Science Park, Pak Shek Kok, Hong Kong
Germany: Arnold-Graffi-Haus / D85 Robert-Rössle-Straße 10 13125 Berlin
United States: (CA) 2 Goddard, Irvine, CA 92618
United States: (IL) 8255 Lemont Rd, #1, Darien, IL 60561
Hong Kong: Unit 615, Building 11W, Hong Kong Science Park, Pak Shek Kok, Hong Kong
Germany: Arnold-Graffi-Haus / D85 Robert-Rössle-Straße 10 13125 Berlin
United States: (CA) 2 Goddard, Irvine, CA 92618
United States: (IL) 8255 Lemont Rd, #1, Darien, IL 60561
Hong Kong: Unit 615, Building 11W, Hong Kong Science Park, Pak Shek Kok, Hong Kong

 EN
EN
 de
de