
Single-cell RNA sequencing (scRNA-seq) can reveal transcriptionally defined cell populations, cell states, marker genes, and gene-expression programs at high resolution. However, most scRNA-seq workflows profile dissociated cells or nuclei, which means the original tissue architecture and spatial relationships are not retained.
For that reason, key findings from scRNA-seq often benefit from orthogonal or spatial follow-up. The right validation method depends on what you need to confirm: a small set of marker genes, the location of a cell population, a broader gene signature, a protein phenotype, or a predicted cell-cell interaction.
No single technology validates every type of scRNA-seq result. A strong validation strategy starts with the biological question, then matches the assay to the number of targets, sample type, spatial resolution, and level of molecular information required.
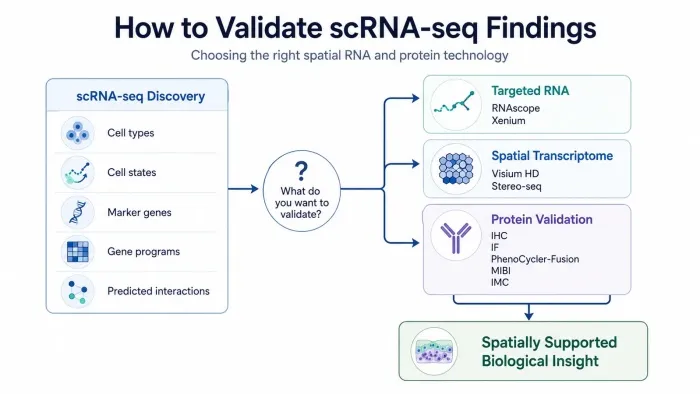
Figure 1. A practical framework for choosing spatial RNA, transcriptome-wide, or protein follow-up after scRNA-seq.
Validation Question | Typical Technologies |
Cell-type identity or marker co-expression | RNAscope, smFISH, Xenium |
Spatial localization of a cell population | Xenium, Visium HD, Stereo-seq, multiplex imaging |
A broad gene-expression program or tissue domain | Visium HD or Stereo-seq |
Protein expression or cellular phenotype | IHC, immunofluorescence, PhenoCycler-Fusion, MIBI, IMC, CyCIF |
A predicted cell-cell communication relationship | Spatial RNA and/or protein profiling, followed by functional validation when needed |
Important: scRNA-seq measures RNA, not protein abundance. Protein-level conclusions should therefore be confirmed with an appropriate protein assay rather than inferred from transcript levels alone.
In situ hybridization methods detect RNA directly in intact tissue sections while preserving spatial context. They are well suited to confirming marker-gene expression, co-expression patterns, and the localization of transcriptionally defined cell populations.
Technology | Typical Scale | Best Use |
RNAscope | Single-molecule sensitivity; low- to moderate-plex depending on assay | High sensitivity and specificity; widely used with FFPE tissue; useful for focused marker validation |
smFISH | Single-molecule detection; typically focused panels in classical workflows | Direct RNA molecule counting and precise subcellular localization; multiplexed extensions are available |
Xenium In Situ | Subcellular targeted RNA detection; from tens/hundreds of genes to ~5,000-gene panels depending on chemistry | High-plex spatial cell typing and gene-expression analysis in FFPE and fresh-frozen tissue |
A few key RNA markers: RNAscope or smFISH is often the most efficient option.
Dozens to hundreds of targeted genes: Xenium is better suited to high-plex spatial confirmation and cell typing.
Thousands of targeted genes: Xenium Prime 5K expands the targeted panel to approximately 5,000 genes, but it is still a targeted assay rather than a whole-transcriptome method.
If the goal is to map broader transcriptional programs without restricting the experiment to a predefined target panel, whole-transcriptome spatial transcriptomics can extend scRNA-seq findings across intact tissue.
Technology | Spatial Feature / Resolution | Strengths |
Visium HD | Continuous 2 × 2 µm barcoded squares; single-cell-scale spatial gene-expression analysis | Whole-transcriptome spatial profiling with tissue morphology; compatible workflows are available for fresh-frozen and FFPE samples |
Stereo-seq | 500 nm spatial resolution | Whole-transcriptome spatial profiling with high spatial resolution and a large field of view; useful for tissue-scale mapping |
A useful distinction: Visium HD and Stereo-seq are often better described as spatial extensions of transcriptomic discovery rather than fully independent validation methods. They can test whether scRNA-seq-derived cell types and gene signatures are spatially consistent with tissue architecture, but they still measure RNA.
Whether scRNA-seq-defined cell populations are enriched in expected anatomical regions
Whether marker genes and gene signatures show the predicted spatial pattern
Whether disease-associated transcriptional programs are restricted to specific tissue compartments
Whether putative cellular neighborhoods identified computationally are supported by spatial proximity
RNA abundance and protein abundance are related but not interchangeable. If a biological conclusion depends on a protein marker, receptor, signaling protein, or cell phenotype, protein-level validation provides a more direct line of evidence.
Immunohistochemistry (IHC): A familiar pathology workflow for confirming the presence and tissue localization of one or a small number of protein markers. Signal is generally interpreted semi-quantitatively.
Immunofluorescence (IF): Useful for co-localization of several proteins in the same tissue section. Practical plex depends on the fluorophores, imaging system, spectral overlap, and assay design.
Technology | Typical Plex | Key Feature |
PhenoCycler-Fusion | 100+ markers can be achieved | DNA-barcoded antibodies with iterative fluorescence imaging; supports high-plex spatial phenotyping |
MIBI | Up to ~40 biomarkers simultaneously | Metal-labeled antibodies measured by ion-beam mass spectrometric imaging; minimizes fluorescence background and spectral overlap |
Imaging Mass Cytometry (IMC) | 40+ markers | Metal-tagged antibodies with laser ablation and mass cytometry for highly multiplexed spatial protein analysis |
CyCIF | Dozens of markers; ~60-plex is established in published workflows | Iterative staining, imaging, and fluorophore inactivation using broadly available immunofluorescence reagents and microscopy platforms |
These methods are useful for testing whether transcriptomically defined cell populations are present in the expected tissue regions, whether immune or stromal phenotypes are spatially organized, and whether protein-level neighborhoods support hypotheses generated from scRNA-seq.
However, spatial proximity does not prove functional interaction. A ligand-receptor prediction or cell-cell communication score from scRNA-seq is a hypothesis. Spatial co-localization can strengthen that hypothesis, but functional interaction may still require perturbation, receptor blocking, imaging of signaling activity, or another mechanistic assay.
Identify cell populations, cell states, marker genes, and gene-expression programs. Cell-cell communication analysis can generate hypotheses about potential signaling relationships.
Use RNAscope or smFISH for a few genes, or Xenium for larger targeted panels, to confirm that key markers and cell populations occur in the expected tissue locations.
Use IHC, IF, or high-plex protein imaging to test whether key transcriptional findings are reflected at the protein level.
Use Visium HD or Stereo-seq when the goal is to map broader gene-expression programs across tissue rather than validate only a predefined set of targets.
Section-matching matters: When combining different spatial platforms, serial or adjacent tissue sections are often the most practical design. Same-section multi-omics is possible for selected platform-specific workflows, but it should not be assumed to work across every technology combination.
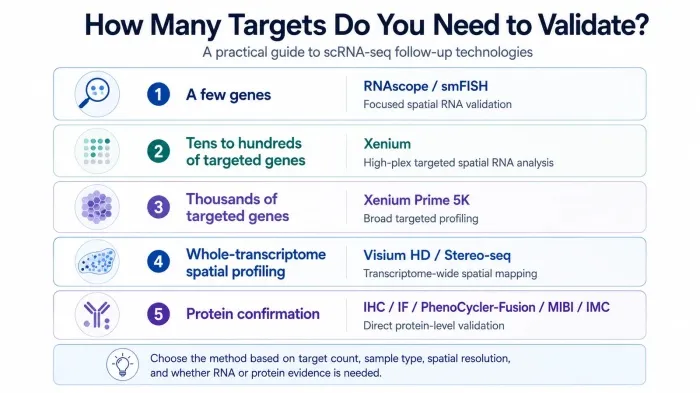
Figure 2. Match the follow-up method to target scale and the type of evidence needed.
Research Goal | Recommended Approach | Why |
Confirm <5 RNA markers in tissue | RNAscope or smFISH | Focused, sensitive spatial confirmation |
Confirm tens to hundreds of targeted genes | Xenium | High-plex targeted spatial RNA analysis |
Confirm thousands of targeted genes | Xenium Prime 5K | Broad targeted spatial discovery; not whole transcriptome |
Map transcriptome-wide patterns | Visium HD or Stereo-seq | Unbiased/broad spatial transcriptomic profiling |
Confirm a small number of protein markers | IHC or conventional IF | Direct protein localization with relatively simple workflows |
Profile many protein markers spatially | PhenoCycler-Fusion, MIBI, IMC, or CyCIF | High-plex spatial phenotyping |
Test a predicted cell-cell interaction | Spatial RNA/protein evidence + functional assay when needed | Co-localization supports, but does not by itself prove, functional interaction |
No. Validation should focus on findings that are central to the biological conclusion, unexpected, clinically or mechanistically important, or especially sensitive to annotation and computational assumptions.
No. Xenium is a targeted in situ platform. Xenium v1 supports smaller targeted panels, while Xenium Prime 5K expands coverage to approximately 5,000 genes. That is high-plex targeted profiling, not whole-transcriptome sequencing.
Yes, with an important nuance. Visium HD can test whether scRNA-seq-derived cell populations and gene-expression programs map to biologically plausible tissue regions. Because both approaches measure RNA, it is best viewed as spatial confirmation and extension rather than a completely independent molecular validation.
Xenium is targeted and offers subcellular in situ RNA detection, making it well suited to focused high-plex validation and spatial cell typing. Visium HD is whole-transcriptome and is better suited to broader spatial discovery when you do not want to limit analysis to a predefined gene panel.
No. Co-localization can support a predicted interaction, but functional signaling generally requires additional evidence such as perturbation, receptor blocking, pathway activation readouts, or other mechanistic experiments.
If you are planning a single-cell sequencing study and are unsure how to validate the key findings, start with four questions: What sample type do you have? How many targets need to be confirmed? Do you need targeted validation or transcriptome-wide spatial discovery? And is RNA-level evidence sufficient, or is protein-level confirmation also required?
Omics Empower supports end-to-end single-cell sequencing and spatial transcriptomics workflows, including Visium HD, Xenium, and Stereo-seq, from study design and sample assessment through data generation and bioinformatics analysis.
Our team has supported more than 500 peer-reviewed publications across single-cell and spatial transcriptomics research, including studies published in Nature, Science, and Cell。
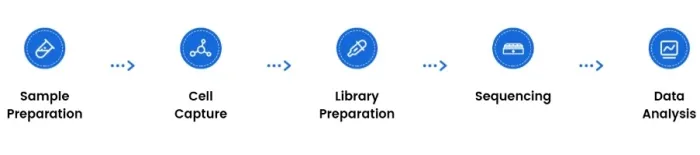
Omics Empower workflow overview
Whether you are working with fresh cells, fresh tissue, frozen samples, or clinically collected material, we can help assess the most suitable workflow for your project.
scRNA-seq vs. snRNA-seq: How to Choose the Right Workflow for Your Study
A Complete Guide to Single-Nucleus RNA Sequencing (snRNA-seq)
How to Use Flow Cytometry (FACS) Effectively for Single-Cell Sequencing
Seeing the Bigger Picture: How Stereo-seq Large-Format Chips Expand Spatial Transcriptomics
1. Luecken MD, Theis FJ. Current best practices in single-cell RNA-seq analysis: a tutorial. *Molecular Systems Biology*. 2019;15:e8746. https://doi.org/10.15252/msb.20188746
2. Longo SK, Guo MG, Ji AL, Khavari PA. Integrating single-cell and spatial transcriptomics to elucidate intercellular tissue dynamics. *Nature Reviews Genetics*. 2021;22:627–644. https://doi.org/10.1038/s41576-021-00370-8
3. Wang F, Flanagan J, Su N, et al. RNAscope: A novel in situ RNA analysis platform for formalin-fixed, paraffin-embedded tissues. *The Journal of Molecular Diagnostics*. 2012;14(1):22–29. https://doi.org/10.1016/j.jmoldx.2011.08.002
4. Raj A, van den Bogaard P, Rifkin SA, van Oudenaarden A, Tyagi S. Imaging individual mRNA molecules using multiple singly labeled probes. *Nature Methods*. 2008;5:877–879. https://doi.org/10.1038/nmeth.1253
5. 10x Genomics. Xenium In Situ Platform. Official product and technical information. Accessed August 2026. https://www.10xgenomics.com/platforms/xenium
6. 10x Genomics. Visium Spatial Assays. Official product and technical information. Accessed August 2026. https://www.10xgenomics.com/platforms/visium/product-family
7. Chen A, Liao S, Cheng M, et al. Spatiotemporal transcriptomic atlas of mouse organogenesis using DNA nanoball-patterned arrays. *Cell*. 2022;185(10):1777–1792.e21. https://doi.org/10.1016/j.cell.2022.04.003
8. STOmics. Stereo-seq: Advanced Spatial Transcriptomics Solutions. Official product and technical information. Accessed August 2026. https://en.stomics.tech/
9. Goltsev Y, Samusik N, Kennedy-Darling J, et al. Deep profiling of mouse splenic architecture with CODEX multiplexed imaging. *Cell*. 2018;174(4):968–981.e15. https://doi.org/10.1016/j.cell.2018.07.010
10. Angelo M, Bendall SC, Finck R, et al. Multiplexed ion beam imaging of human breast tumors. *Nature Medicine*. 2014;20:436–442. https://doi.org/10.1038/nm.3488
11. Giesen C, Wang HAO, Schapiro D, et al. Highly multiplexed imaging of tumor tissues with subcellular resolution by mass cytometry. *Nature Methods*. 2014;11:417–422. https://doi.org/10.1038/nmeth.2869
12. Lin JR, Izar B, Wang S, et al. Highly multiplexed immunofluorescence imaging of human tissues and tumors using t-CyCIF and conventional optical microscopes. *eLife*. 2018;7:e31657. https://doi.org/10.7554/eLife.31657
13. Armingol E, Officer A, Harismendy O, Lewis NE. Deciphering cell–cell interactions and communication from gene expression. *Nature Reviews Genetics*. 2021;22:71–88. https://doi.org/10.1038/s41576-020-00292-x
14. Quanterix. PhenoCycler-Fusion 2.0 Spatial Biology Platform. Official product and technical information. Accessed August 2026. https://www.quanterix.com/phenocycler-fusion-2-0/
Germany: Arnold-Graffi-Haus / D85 Robert-Rössle-Straße 10 13125 Berlin
United States: (CA) 2 Goddard, Irvine, CA 92618
United States: (IL) 8255 Lemont Rd, #1, Darien, IL 60561
Hong Kong: Unit 615, Building 11W, Hong Kong Science Park, Pak Shek Kok, Hong Kong
Germany: Arnold-Graffi-Haus / D85 Robert-Rössle-Straße 10 13125 Berlin
United States: (CA) 2 Goddard, Irvine, CA 92618
United States: (IL) 8255 Lemont Rd, #1, Darien, IL 60561
Hong Kong: Unit 615, Building 11W, Hong Kong Science Park, Pak Shek Kok, Hong Kong
Germany: Arnold-Graffi-Haus / D85 Robert-Rössle-Straße 10 13125 Berlin
United States: (CA) 2 Goddard, Irvine, CA 92618
United States: (IL) 8255 Lemont Rd, #1, Darien, IL 60561
Hong Kong: Unit 615, Building 11W, Hong Kong Science Park, Pak Shek Kok, Hong Kong

 EN
EN
 de
de