

Single-cell RNA sequencing (scRNA-seq) can identify distinct cell populations, but many biological processes are continuous rather than static. Pseudotime analysis computationally orders cells along an inferred biological progression, helping researchers explore differentiation, activation, treatment response, and other cell-state transitions.
Monocle 2 is a widely used trajectory-inference framework found in many published and legacy scRNA-seq analyses. Its main outputs include cell trajectories, pseudotime values, branch points, and genes that change along or between inferred paths. The official documentation now recommends Monocle 3 for new workflows, but Monocle 2 results remain common and require careful interpretation.
Pseudotime is a relative ordering of cells based on transcriptional similarity. It is not real chronological time: a pseudotime value of 10 does not mean that ten hours or ten days have passed. Instead, it indicates that a cell is positioned farther along the inferred trajectory than cells with lower values.
The interpretation depends on which cells were included, which ordering genes were selected, how technical effects were controlled, and which trajectory state was chosen as the starting point. Pseudotime should therefore be treated as a computational model of progression rather than direct evidence of cellular history.
Monocle 2 uses reversed graph embedding to place cells in a reduced-dimensional space and learn a principal graph through the data. In the trajectory plot, each point represents a cell, while the connecting lines summarize the inferred transcriptional relationships among cells. This framework was described in the Monocle 2 Nature Methods paper.
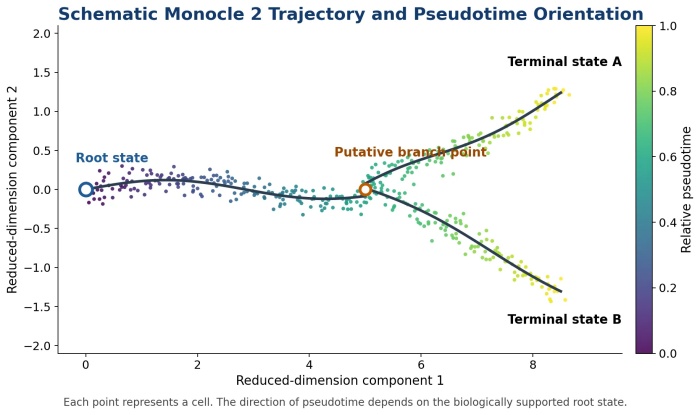
Figure 1. Schematic Monocle 2 trajectory. Each point represents a cell; pseudotime direction depends on the biologically supported root state.
Monocle 2 does not automatically know which end of the trajectory is biologically early. Researchers should select the root state using evidence such as earlier experimental time points, enrichment of progenitor markers, absence of mature markers, or established lineage knowledge. A poorly supported root can reverse the apparent direction of progression.
A branch point represents a putative divergence in transcriptional state. It may be consistent with alternative differentiation outcomes or cell states, but it does not by itself prove a true lineage-fate decision. Batch effects, cell-cycle differences, stress responses, missing intermediate cells, or inappropriate cell selection can also create apparent branches.
A standard pseudotime heatmap displays genes in rows and cells or fitted expression values ordered by pseudotime across columns. Genes with similar patterns are grouped into modules, which may represent coordinated transcriptional programs. Module numbers and colors are dataset-specific and do not have universal biological meanings.
For a branched trajectory, Monocle 2 can use Branched Expression Analysis Modeling (BEAM) to identify genes with different expression patterns between two paths. In a typical branched heatmap, the shared pre-branch region is near the center, while the two alternative trajectories extend toward opposite sides. The horizontal axis is therefore not a simple left-to-right early-to-late sequence.
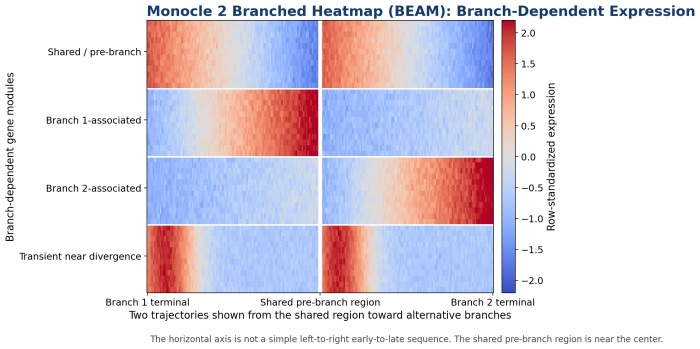
Figure 2. Schematic Monocle 2 branched heatmap. The shared pre-branch region is near the center, with alternative branches extending toward opposite sides.
Genes enriched along one branch may be described as branch-associated markers or candidate regulators for further investigation. A heatmap alone cannot establish that a gene drives differentiation or controls cell fate. Functional enrichment, regulatory analysis, and experimental validation are needed before making causal claims.
GeneSwitches is an independent downstream method rather than a built-in Monocle 2 output. It converts gene expression into ON and OFF states and uses logistic regression to estimate where each gene changes state along an existing pseudotime trajectory.
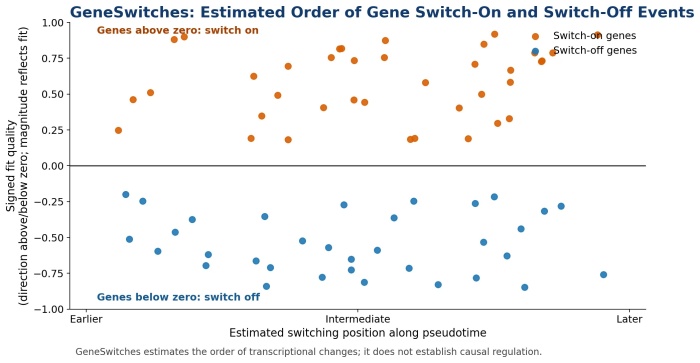
Figure 3. Schematic GeneSwitches plot showing the estimated order of gene switch-on and switch-off events along pseudotime.
In a typical plot, the x-axis shows the estimated switching position. Genes above the horizontal line switch on, while genes below it switch off. The distance from the line reflects model-fit quality. GeneSwitches helps order transcriptional events, but it does not prove that a gene causes the transition.
· Confirm the root state using time points, known markers, or independent biological evidence.
· Analyze biologically related cells; unrelated populations can create misleading trajectories.
· Check whether batch effects, cell cycle, stress, or low-quality cells dominate the structure.
· Treat branch-associated genes as hypotheses, not proven lineage regulators.
· Validate results with biological replicates, marker expression, complementary methods, or functional experiments where possible.
Monocle 2 can help visualize continuous cell-state changes, identify putative branches, and detect dynamic or branch-dependent genes. Reliable interpretation requires biologically supported root selection, careful quality control, and cautious language: pseudotime is not chronological time, and computational branches do not independently prove lineage relationships.
If you are planning a single-cell sequencing project, Omics Empower can support your research with professional single-cell sequencing services.
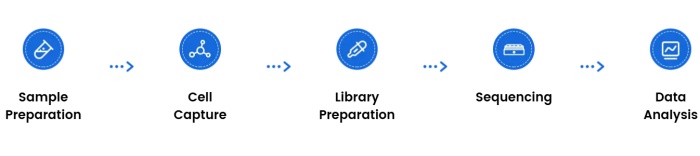
Researchers worldwide trust our data: more than 500 peer-reviewed publications have been generated using our single-cell and spatial transcriptomics services, including studies in Nature, Science, and Cell. From library preparation to bioinformatics and publication-ready figures, we deliver end-to-end support to help you advance your next single-cell project.
Qiu X, Mao Q, Tang Y, et al. Reversed graph embedding resolves complex single-cell trajectories. Nature Methods. 2017;14:979-982.
Trapnell C, Cacchiarelli D, Grimsby J, et al. The dynamics and regulators of cell fate decisions are revealed by pseudotemporal ordering of single cells. Nature Biotechnology. 2014;32:381-386.
Cao Y, Kitanovski S, Kuppers R, Hoffmann D. GeneSwitches: ordering gene-expression and functional events in single-cell experiments. Bioinformatics. 2020;36(10):3273-3275.
Cole-Trapnell Lab. Monocle 2 documentation.
Germany: Arnold-Graffi-Haus / D85 Robert-Rössle-Straße 10 13125 Berlin
United States: (CA) 2 Goddard, Irvine, CA 92618
United States: (IL) 8255 Lemont Rd, #1, Darien, IL 60561
Hong Kong: Unit 615, Building 11W, Hong Kong Science Park, Pak Shek Kok, Hong Kong
Germany: Arnold-Graffi-Haus / D85 Robert-Rössle-Straße 10 13125 Berlin
United States: (CA) 2 Goddard, Irvine, CA 92618
United States: (IL) 8255 Lemont Rd, #1, Darien, IL 60561
Hong Kong: Unit 615, Building 11W, Hong Kong Science Park, Pak Shek Kok, Hong Kong
Germany: Arnold-Graffi-Haus / D85 Robert-Rössle-Straße 10 13125 Berlin
United States: (CA) 2 Goddard, Irvine, CA 92618
United States: (IL) 8255 Lemont Rd, #1, Darien, IL 60561
Hong Kong: Unit 615, Building 11W, Hong Kong Science Park, Pak Shek Kok, Hong Kong

 EN
EN
 de
de